
How to Measure Customer Experience (CX): 9 Metrics & Case Study Insights
Customer Experience (CX) provides valuable insights into the perception a brand leaves on its customers. Measuring customer experience empowers businesses to deeply understand their customers’ sentiments towards their brand. While Customer Experience can be assessed through various tools and methodologies, it’s crucial to recognize that it’s influenced by the efforts of every department or unit within the company, extending beyond just customer service.
“We see our customers as invited guests to a party, and we are the hosts. It’s our job every day to make every important aspect of the customer experience a little bit better.” – Jeff Bezos
“It takes 20 years to build a reputation and five minutes to ruin it. If you think about that, you’ll do things differently.” – Warren Buffett
In this article, we talk about:
- How to measure CX with 9 metrics
- Example Scenarios for each metric
- Business case study
- Conclusion
9 Key Metrics to Measure Customer Experience (CX):
Measure Customer Experience with one or more of the following metrics:
- Net Promoter Score (NPS)
- Customer satisfaction scores (CSAT)
- Customer Effort Score (CES)
- Churn Rate
- Retention Rate
- Customer Lifetime Value (CLV)
- First response time (FRT)
- Average resolution time (ART)
- First contact resolution (FCR)
| Metric | Reason for Use |
| Net Promoter Score (NPS) | Measures customer loyalty and likelihood to recommend. |
| Customer Satisfaction (CSAT) | Assesses overall satisfaction with products or services. |
| Retention Rate | Indicates customer loyalty and long-term engagement. |
| Churn Rate | Measures customer attrition and identifies retention issues. |
| Customer Lifetime Value (CLV) | Evaluates the long-term value of customers to the business. |
| First Response Time (FRT) | Reflects responsiveness and efficiency of customer service. |
| Average Resolution Time (ART) | Indicates efficiency in resolving customer inquiries or issues. |
| First Contact Resolution (FCR) | Reflects effectiveness in resolving customer issues on the first interaction. |
NPS:
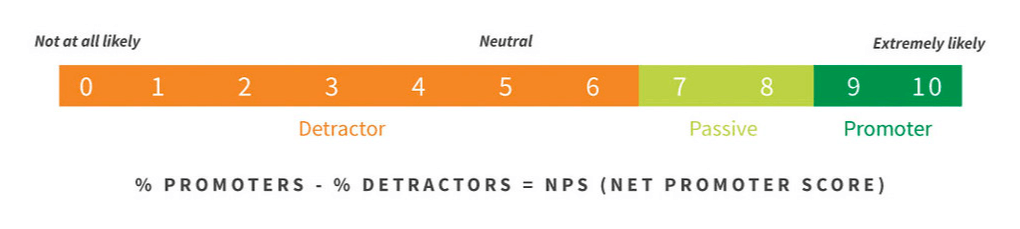
Net Promoter Score (NPS) is measured through a simple survey question that asks customers to rate, on a scale from 0 to 10, how likely they are to recommend a company’s product or service to others. The NPS survey typically consists of the following steps:
- Survey Distribution: The NPS survey is typically distributed via various channels such as email, SMS, website pop-ups, or within mobile apps. It can be triggered at different touchpoints in the customer journey, such as after a purchase, interaction with customer service, or after using a product or service.
- Rating Scale: Customers are asked to rate their likelihood of recommending the company on a scale from 0 to 10, with 0 being “Not at all likely” and 10 being “Extremely likely.”
- Categorization of Responses:
- Promoters (Score 9-10): Customers who select a score of 9 or 10 are considered promoters. They are highly satisfied and likely to recommend the company to others.
- Passives (Score 7-8): Customers who select a score of 7 or 8 are considered passives. They are satisfied but not as enthusiastic as promoters.
- Detractors (Score 0-6): Customers who select a score of 0 to 6 are considered detractors. They are dissatisfied and may potentially harm the company’s reputation through negative word-of-mouth.
- Calculation of NPS:
To calculate the Net Promoter Score, the percentage of detractors is subtracted from the percentage of promoters. Passives are not included in the calculation. The formula is:
NPS = {Percentage of Promoters} – {Percentage of Detractors}
The resulting NPS can range from -100 to +100. A positive score indicates that there are more promoters than detractors, while a negative score indicates the opposite.
5. Analysis and Action: Once the NPS data is collected, it is analyzed to identify trends, areas for improvement, and opportunities to enhance the customer experience. Companies often follow up with detractors to gather feedback and address their concerns, while also engaging with promoters to encourage advocacy and loyalty.
6. Continuous Monitoring: NPS is often measured regularly to track changes over time and assess the effectiveness of initiatives aimed at improving the customer experience. By monitoring NPS consistently, companies can identify shifts in customer sentiment and make informed decisions to drive growth and customer satisfaction.
Overall, the simplicity and effectiveness of the NPS methodology make it a popular metric for measuring customer loyalty and satisfaction across industries.
CSAT
CSAT, or Customer Satisfaction Score, is a metric used to measure how satisfied customers are with a specific interaction, transaction, or experience with a company’s product or service. CSAT is typically measured through surveys or feedback mechanisms that ask customers to rate their satisfaction based on their recent experience.
Here’s how to measure CSAT:

- Survey Distribution: Decide when and where you want to gather feedback from customers. Surveys can be distributed immediately after a customer interaction, such as after a customer support call, live chat session, or completion of a transaction. They can also be sent via email, embedded on a website, or included in an app.
- Survey Design: Design a simple and straightforward survey that asks customers to rate their satisfaction based on their recent experience. The most common CSAT survey question asks customers to rate their satisfaction on a scale, typically from 1 to 5 or from 1 to 10, with options such as “Very Dissatisfied,” “Dissatisfied,” “Neutral,” “Satisfied,” and “Very Satisfied.”
- Data Collection: Collect responses from customers who have interacted with your company. Ensure that the survey is easily accessible and convenient for customers to complete. Consider offering incentives or rewards to encourage participation.
- Calculation of CSAT Score: Once you have collected responses, calculate the CSAT score by aggregating the ratings and determining the percentage of satisfied customers. For example, if you received 100 responses and 80 customers rated their satisfaction as “Satisfied” or “Very Satisfied,” your CSAT score would be 80%.
CSAT Score = {Number of Satisfied Responses} / {Total Number of Responses} 100%
- Analysis and Action: Analyze the CSAT data to identify trends, patterns, and areas for improvement. Pay attention to recurring themes or issues mentioned by dissatisfied customers. Use the feedback to make informed decisions and take appropriate actions to address customer concerns and improve the overall customer experience.
- Continuous Monitoring: Monitor CSAT scores over time to track changes in customer satisfaction and the effectiveness of any actions taken to improve satisfaction levels. Continuously solicit feedback from customers to ensure that their needs and expectations are being met.
By measuring CSAT, companies can gain valuable insights into customer satisfaction levels, identify opportunities for improvement, and take proactive steps to enhance the customer experience.
Customer Effort Score (CES)
Customer Effort Score (CES) is a metric used to measure the level of effort customers exert to complete a specific task, such as resolving an issue, making a purchase, or seeking assistance from customer service. The underlying principle of CES is that reducing customer effort leads to higher satisfaction, loyalty, and retention.
Here’s how to measure CES:
- Survey Design: Design a survey question that asks customers to rate the level of effort required to complete a particular task. The most common CES survey question is, “How much effort did you personally have to put forth to handle your request?” Customers typically respond on a scale from “Very Low Effort” to “Very High Effort.”
- Survey Distribution: Determine when and where you want to gather feedback from customers. CES surveys can be distributed via various channels, such as email, after a customer interaction, or embedded on a website or app immediately after the completion of a task.
- Data Collection: Collect responses from customers who have recently completed the specific task or interaction. Ensure that the survey is easily accessible and convenient for customers to complete. Consider offering incentives or rewards to encourage participation.
- Calculation of CES Score: Once you have collected responses, calculate the CES score by aggregating the ratings and determining the average level of effort required by customers. The scale used in the survey question may vary (e.g., 1 to 5, 1 to 7), so be sure to adjust accordingly.
For example, if you received 100 responses and the average rating was 4 on a scale of 1 to 5, the CES score would be 4.
- Analysis and Action: Analyze the CES data to identify trends, patterns, and areas for improvement. Pay attention to instances where customers reported high levels of effort, as these may indicate pain points or areas of friction in the customer journey. Use the feedback to make informed decisions and take appropriate actions to reduce customer effort and improve the overall customer experience.
- Continuous Monitoring: Monitor CES scores over time to track changes in customer effort and the effectiveness of any actions taken to streamline processes and reduce friction in the customer journey. Continuously solicit feedback from customers to ensure that efforts to improve the customer experience are having the desired impact.
By measuring CES, companies can gain valuable insights into the ease of doing business with their organization and identify opportunities to simplify processes, eliminate barriers, and enhance the overall customer experience.
Churn Rate:
Churn rate refers to the percentage of customers who stop using a company’s product or service over a specific period. It is a crucial metric for businesses, especially subscription-based or recurring revenue models, as it directly impacts revenue and growth. A high churn rate indicates that the company is losing customers, while a low churn rate suggests customer retention and loyalty.
Measuring Churn Rate:
To calculate churn rate, follow these steps:
- Determine the Time Period: Choose a specific time period for which you want to calculate churn rate, such as a month, quarter, or year.
- Count Customers Lost: Count the number of customers who stopped using your product or service during the chosen time period. This includes canceled subscriptions, non-renewals, or lost customers.
- Determine Initial Customer Base: Determine the total number of customers at the beginning of the time period.
- Calculate Churn Rate: Use the formula below to calculate churn rate:
Churn Rate = {Number of Customers Lost} / {Initial Customer Base} * 100%
- Interpretation: The resulting percentage represents the churn rate for the specified time period. For example, if you had 1000 customers at the beginning of the month and lost 50 customers during the month, the churn rate would be 5%.
Retention Rate:
Retention rate is the percentage of customers or subscribers that a company retains over a specific period. It is a key metric for businesses to measure customer loyalty and the effectiveness of their efforts in retaining customers. A high retention rate indicates that a company is successful in keeping its customers engaged and satisfied, while a low retention rate may signify issues with product quality, customer service, or overall customer experience.
Measuring Retention Rate:
To calculate retention rate, follow these steps:
- Determine the Time Period: Choose a specific time period for which you want to calculate retention rate, such as a month, quarter, or year.
- Count Customers Retained: Count the number of customers or subscribers that remain active or continue using your product or service throughout the chosen time period.
- Determine Initial Customer Base: Determine the total number of customers or subscribers at the beginning of the time period.
- Calculate Retention Rate: Use the formula below to calculate retention rate:
Retention Rate = {Number of Customers Retained} / {Initial Customer Base} * 100%
- Interpretation: The resulting percentage represents the retention rate for the specified time period. For example, if you had 1000 customers at the beginning of the month and retained 950 customers by the end of the month, the retention rate would be 95%.
Customer Lifetime Value (CLV):
Customer Lifetime Value (CLV) is a metric that represents the total revenue a business can expect from a single customer over the entire duration of their relationship. It is a crucial metric for businesses to understand the long-term value of their customers and make informed decisions regarding customer acquisition, retention, and marketing strategies.
Measuring Customer Lifetime Value (CLV):
To calculate CLV, follow these steps:
- Determine the Time Period: Choose a specific time period over which you want to calculate CLV, such as a year or the entire lifespan of the customer relationship.
- Calculate Average Purchase Value: Determine the average purchase value by dividing the total revenue generated from all transactions by the total number of transactions within the chosen time period.
- Calculate Average Purchase Frequency: Determine the average purchase frequency by dividing the total number of transactions by the total number of unique customers within the chosen time period.
- Calculate Customer Lifespan: Determine the average customer lifespan by calculating the average number of years a customer continues to purchase from your business.
- Calculate CLV: Use the formula below to calculate CLV:
CLV = {Average Purchase Value} * {Average Purchase Frequency} * {Customer Lifespan}
First Response Time (FRT):
First Response Time (FRT) refers to the duration it takes for a company or support team to respond to an initial inquiry or request from a customer. It is a critical metric in customer service and support operations as it directly impacts customer satisfaction and perceived responsiveness.
Measuring First Response Time (FRT):
To measure FRT, follow these steps:
- Define Communication Channels: Determine the communication channels through which customers can reach out to your company, such as email, phone, live chat, or social media.
- Track Initial Inquiries: Track the timestamp of the initial inquiry or request received from a customer through any of the communication channels.
- Calculate Time Taken to Respond: Calculate the time taken by your support team to provide the first response to the customer’s inquiry or request. This is typically measured from the time the inquiry is received to the time the first response is sent.
- Aggregate Data: Aggregate FRT data across all communication channels and calculate the average first response time over a specific time period, such as a day, week, or month.
Average Resolution Time (ART):
Average Resolution Time (ART) refers to the average amount of time it takes for a company or support team to resolve a customer inquiry or issue from the moment it is reported until it is successfully resolved. It is a key performance indicator in customer service operations, reflecting the efficiency and effectiveness of a company’s support processes.
Measuring Average Resolution Time (ART):
To measure ART, follow these steps:
- Define Resolution Criteria: Clearly define what constitutes resolution for different types of inquiries or issues. For example, resolution may involve providing a solution to a technical problem, processing a refund, or addressing a billing inquiry.
- Track Resolution Time: Track the timestamp when a customer inquiry or issue is reported and the timestamp when it is successfully resolved by the support team.
- Calculate Resolution Time: Calculate the time taken to resolve each inquiry or issue by subtracting the timestamp of resolution from the timestamp when the inquiry was reported.
- Aggregate Data: Aggregate resolution time data across all resolved inquiries or issues within a specific time period, such as a day, week, or month.
- Calculate Average Resolution Time: Calculate the average resolution time by dividing the total resolution time by the number of resolved inquiries or issues within the chosen time period.
First Contact Resolution (FCR):
First Contact Resolution (FCR) is a metric that measures the percentage of customer inquiries or issues that are resolved satisfactorily during the first interaction with a customer service representative, without the need for further follow-up or escalation. FCR is an important indicator of customer service efficiency and effectiveness, as it reflects the ability of a company to address customer needs promptly and efficiently.
Measuring First Contact Resolution (FCR):
To measure FCR, follow these steps:
- Define Resolution Criteria: Clearly define what constitutes resolution for different types of customer inquiries or issues. For example, resolution may involve providing a solution to a technical problem, answering a question, or processing a transaction.
- Track Customer Interactions: Track each customer interaction with your customer service team, including the nature of the inquiry or issue and the outcome of the interaction.
- Identify Repeat Contacts: Identify instances where a customer contacts the customer service team multiple times for the same inquiry or issue.
- Determine First Contact Resolution: Determine whether each customer inquiry or issue was resolved satisfactorily during the first interaction with a customer service representative or if it required further follow-up or escalation.
- Calculate FCR: Calculate the percentage of customer inquiries or issues that were resolved satisfactorily during the first interaction by dividing the number of inquiries resolved on the first contact by the total number of inquiries received and multiplying by 100.
How should your business measure customer experience?
| Metric | Implementation | Case Scenario |
| Net Promoter Score (NPS) | Send out surveys asking customers how likely they are to recommend the brand. | ABC Electronics sends NPS surveys after purchases. They receive a score of 75, indicating high customer advocacy. |
| Customer Satisfaction (CSAT) | Conduct post-purchase or post-interaction surveys asking customers to rate their experience. | XYZ Restaurant implements CSAT surveys for dine-in customers. They achieve a CSAT score of 4.5 out of 5, signaling high satisfaction. |
| Retention Rate | Track the percentage of customers retained over a period. | ABC Gym calculates their retention rate to be 80% for the year, showing strong customer loyalty. |
| Churn Rate | Monitor the percentage of customers who stop using the service or cancel subscriptions. | XYZ Streaming Service observes a churn rate of 10% for the quarter, prompting efforts to improve customer retention. |
| Customer Lifetime Value (CLV) | Analyze total revenue generated from a customer over their lifetime with the company. | ABC Online Retail calculates the CLV of a typical customer to be $1500, guiding marketing and retention strategies. |
| First Response Time (FRT) | Track the time it takes for customer service to respond to inquiries or issues. | XYZ Tech Support maintains an average FRT of 1 hour, ensuring prompt assistance for customers. |
| Average Resolution Time (ART) | Measure the time taken to resolve customer inquiries or issues from start to finish. | ABC Software Solutions reduces their ART to 24 hours, enhancing customer satisfaction with quicker issue resolution. |
| First Contact Resolution (FCR) | Monitor the percentage of customer inquiries or issues resolved satisfactorily during the first interaction. | XYZ Bank achieves an FCR rate of 85%, indicating efficient customer service and problem resolution. |
Case Scenario: ABC Fitness Center
Background:
ABC Fitness Center is a chain of gyms operating in several locations. The company aims to enhance its customer experience and improve overall business performance. To achieve this, ABC Fitness Center decides to implement various customer experience metrics including Net Promoter Score (NPS), Customer Satisfaction (CSAT), Retention Rate, Churn Rate, Customer Lifetime Value (CLV), First Response Time (FRT), Average Resolution Time (ART), and First Contact Resolution (FCR).
Implementation of Metrics:
- NPS and CSAT: ABC Fitness Center implements NPS and CSAT surveys to gauge customer loyalty and satisfaction. After each visit, customers receive a survey asking them to rate their likelihood to recommend the gym (NPS) and satisfaction with their experience (CSAT).
- Retention Rate and Churn Rate: The gym tracks the number of members who renew their subscriptions (Retention Rate) and the number of members who cancel their memberships (Churn Rate) over a specified period.
- CLV: ABC Fitness Center calculates the CLV for each member by estimating the total revenue generated from the member’s subscription fees, additional purchases, and referrals over their membership lifetime.
- FRT and ART: The gym measures the time taken for staff to respond to customer inquiries (FRT) and resolve customer issues (ART) through various communication channels such as phone, email, and in-person interactions.
- FCR: ABC Fitness Center tracks the percentage of customer inquiries or issues resolved satisfactorily during the first interaction with a staff member without the need for further follow-up or escalation.
Interpreting Scores:
– NPS: ABC Fitness Center receives an NPS score of 70, indicating a high level of customer advocacy. This suggests that the majority of members are likely to recommend the gym to others, reflecting positive experiences.
– CSAT: The gym achieves a CSAT score of 4.5 out of 5, indicating high levels of satisfaction among members. Most members are satisfied with their experience at the gym, contributing to positive word-of-mouth and retention.
– Retention Rate and Churn Rate: ABC Fitness Center has a retention rate of 85%, indicating strong member loyalty. However, the churn rate is 15%, suggesting that there is room for improvement in retaining members.
– CLV: The CLV for an average member is calculated to be $1000 over their membership lifetime. This provides insights into the long-term value of each member and informs retention and marketing strategies.
– FRT and ART: The average FRT is 1 hour, indicating prompt responsiveness to customer inquiries. However, the ART is 2 days, suggesting that there is room for improvement in resolving customer issues more efficiently.
– FCR: ABC Fitness Center achieves an FCR rate of 80%, indicating that 80% of customer inquiries or issues are resolved satisfactorily during the first interaction. This reflects effective customer service practices but also highlights areas for further improvement.
Action Plan:
- Based on the positive NPS and CSAT scores, ABC Fitness Center focuses on leveraging satisfied members to promote the gym through referral programs.
- To improve retention and reduce churn, the gym offers personalized training programs, loyalty rewards, and incentives for long-term memberships.
- ABC Fitness Center aims to streamline its customer service operations by reducing ART through additional staff training, improved processes, and better use of technology.
- The gym prioritizes enhancing FCR by providing staff with the necessary tools and resources to resolve customer inquiries efficiently during the first interaction, thereby improving overall customer satisfaction and loyalty.
By implementing and interpreting these metrics effectively, ABC Fitness Center can enhance its customer experience, drive customer loyalty, and achieve sustainable business growth.
Conclusion:
In summary, effectively measuring customer experience is paramount for businesses navigating the competitive modern landscape. Through a range of metrics including Net Promoter Score (NPS), Customer Satisfaction (CSAT), Churn Rate, Retention Rate, Customer Lifetime Value (CLV), First Response Time (FRT), Average Resolution Time (ART), and First Contact Resolution (FCR), companies gain invaluable insights into their customer service performance and brand perception. These metrics offer actionable data to pinpoint areas for enhancement, elevate customer satisfaction, foster loyalty, and drive sustained success. With a dedicated focus on customer-centricity and continual improvement, organizations can craft memorable experiences that consistently delight and retain customers.